
Sand to Soil Part 8: The First Progress Check, Data Doesn't Lie
By Jeremy Standring
We’ve officially hit the two-week mark in our "Sand to Soil" experiment, and the transformation is nothing short of incredible. If you’ve been following along from the beginning, you know where we started: with a five-gallon Living Roots cloth pot filled with inert, lifeless garden sand. It was a pale, gritty substrate that couldn’t hold water, had almost no microbial biomass, and lacked the basic nutrients needed to sustain a weed, let alone a thriving ecosystem.
But over the last seven episodes, we’ve systematically applied the RSI Method. We added microbe-rich compost for habitat, drenched the system with biological "liquid gold" (compost tea), planted a nitrogen-fixing legume cover crop, and supported the whole engine with a balanced organic N–P–K.
Today, we aren’t just looking at the pot and saying, "Yeah, it looks greener." We are diving into a comprehensive soil health assessment. We’re using the Bluelab Pulse and the MicroBIOMETER to prove that the biology is actually shifting. In the world of regenerative agriculture, data doesn’t lie.
The Visual Evidence: Above-Ground Vitality
Before we even stick a probe into the soil, the visual change is undeniable. Two weeks ago, this was a pot of damp sand. Today, we have a lush, vibrant green canopy of legume seedlings.
Why the Canopy Matters
This green cover isn't just for show. A dense cover crop serves several critical functions in a sandy soil remediation project:
- Temperature Regulation: The foliage shades the soil surface, preventing the sun from baking the delicate microbes we just inoculated.
- Moisture Retention: By reducing surface evaporation, the plants help keep the "habitat" moist.
- Carbon Infiltration: These plants are actively pumping carbon (in the form of sugars) into the ground.
We see strong stem development and deep green leaves, which tells us that the initial dose of organic N–P–K and the nutrients provided by our compost mix are being successfully mineralized and taken up by the plants.

The Hidden Engine: Root Development and Structure
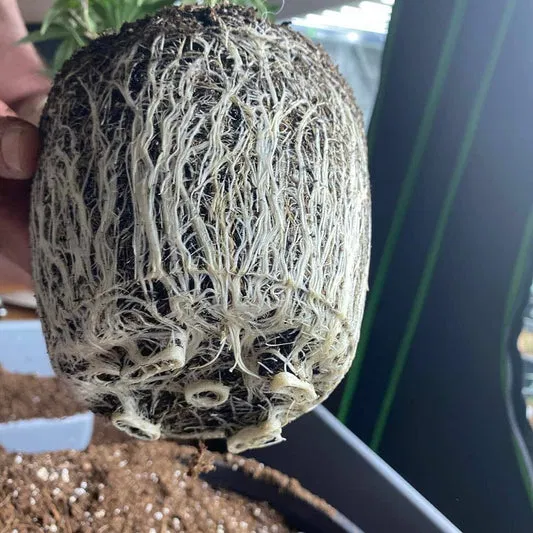
We decided to take a "peek under the hood" by carefully examining the root zone near the edge of the cloth pot. What we found was the first real sign that we are building a living soil.
In pure sand, roots often struggle. They have to work twice as hard to find pockets of moisture and nutrients that haven't leached away. However, in our sand-compost-biology mix, we are seeing thick, white primary roots and a massive network of fine root hairs.
Root exudates: the sugars, amino acids, and organic acids leaked by the roots: are the primary energy source for the soil microbial diversity we’re trying to cultivate. As these legumes grow, they are essentially "hiring" microbes. They trade carbon for nutrients, and in the process, those microbes produce "glues" (like glomalin) that bind sand particles together into aggregates.
When I run my hand through the top inch of the soil now, it doesn't just slip through my fingers like dry grit. It clumps. It has "crumb." That is the beginning of soil structure, and it's being driven by the Rhizo Logic® of the plant-microbe partnership.
Breaking Down the Data: Bluelab Pulse Readings
Now, let’s get into the technicals. We use the Bluelab Pulse because it gives us an immediate snapshot of the physical and chemical environment within the root zone.
1. Electrical Conductivity (EC)
- Baseline (Dead Sand): Almost 0.0 mS/cm.
- Current Reading: 1.2 – 1.5 mS/cm.
This is a massive win. In sandy soils, the biggest problem is "leakiness." You put nutrients in, and they wash straight out. An EC of 1.2 to 1.5 indicates that we have created enough "holding sites" (cation exchange capacity) through the addition of organic matter and the activity of microbes to maintain a stable nutrient profile. It’s high enough to feed the plants but low enough that we aren't at risk of salt burn or biological inhibition.
2. Volumetric Water Content (VWC)
- Baseline: Highly unstable; dropped from 25% to 5% in a single afternoon.
- Current Reading: Holding steady at 18–22% between waterings.
By mixing in 30% microbe-rich compost and establishing a root mat, we have effectively changed the physics of the pot. The soil now acts like a sponge rather than a sieve. This stability is crucial for living soil because microbes need a consistent film of water to move, eat, and reproduce.
3. Temperature
Our readings are holding between 68°F and 74°F. This is the "Goldilocks zone" for soil biology. If the sand were still bare, we’d likely see spikes up to 90°F+ in the sun, which would shut down microbial activity and stress the young roots.

The Biological Shift: MicroBIOMETER Results
This is the part I was most excited about. The MicroBIOMETER allows us to quantify the actual life in the soil: the microbial biomass: and the ratio of fungi to bacteria.
Microbial Biomass
In Episode 2, our dead sand was essentially a biological desert. We had a biomass reading that was barely on the charts.
Today’s Result: We’ve seen a 400% increase in microbial biomass.
This tells us that the "jump start" from the compost tea worked. The microbes didn't just go into the pot and die; they found the compost "habitat" we built, they started eating the organic N–P–K, and they began feasting on the root exudates from our legumes. We aren't just looking at a pot of dirt anymore; we’re looking at a burgeoning city of billions of organisms.
Fungal-to-Bacterial (F:B) Ratio
- Baseline: 0.1:1 (Highly bacterial/lifeless).
- Current Result: 0.6:1.
While we are still "bacterially dominant" (which is expected in a young, disturbed system), the jump in fungal presence is a huge indicator of success. Fungi are the architects of the soil. They are the ones that build the long-term "piping" (hyphae) that transports water and nutrients over long distances. Seeing the F:B ratio move in the right direction proves that our compost and tea were fungal-rich and that the legumes are providing the complex carbons these fungi need to survive.

Systems Thinking: Why This Matters for Your Garden
If you’re a home grower or a commercial farmer with sandy soil, the lesson here is that you don't need to spend thousands on "miracle" products. You need to understand the relationship between the components.
- Compost provides the house.
- Compost Tea provides the residents.
- Cover Crops provide the food (and the air conditioning).
- Organic Fertilizers provide the raw materials for the workers to build with.
When we combine these, as we have in this Living Soil demonstration, we create a self-sustaining loop. The data from our soil health assessment shows that we have successfully flipped the switch. The system is no longer "consuming" inputs to stay alive; it is starting to build its own fertility.
What’s Next in the Sand to Soil Series?
We’ve proven we can wake up the soil. Now, the challenge is keeping it awake and moving it toward maturity. In the next few episodes, we’re going to discuss:
- Managing the Canopy: What happens when the legumes get too big?
- Cycling Nutrients: How we ensure the nitrogen fixed by the legumes actually stays in the soil.
- Advanced Inoculation: Moving beyond basic teas into specialized biological treatments.
If you want to see how your own soil stacks up, I highly recommend looking into our Initial Soil Health (ISH) Assessment. We use these same data-driven tools to help you stop guessing and start growing.
Are you struggling with sandy soil in your garden? Have you tried using cover crops to fix your structure? Drop a comment below: I’d love to hear what’s working (and what’s not) in your neck of the woods!


